Cup and Handle Pattern
Analyzing a stock price chart is one of the most important skills for traders and investors. There are multiple different ways and methods through which one can analyze a chart. A trader can make use of technical indicators or study the price action. While analyzing the price movements of a security, there are multiple patterns that occur which can help traders identify breakouts, reversals or trend continuation giving them trading opportunities. Although there are numerous patterns, we will look at the cup and handle pattern in this article.
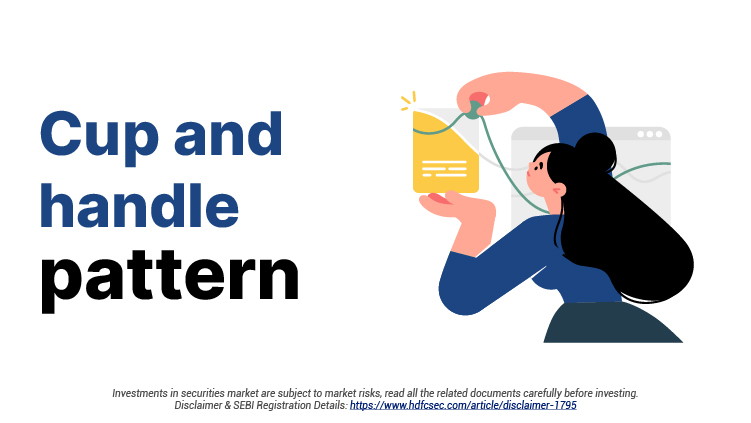
The Cup and Handle Pattern
The cup and handle pattern is a bullish price pattern which indicates a trend continuation or reversal. The pattern is named so, as it looks similar to a cup and a handle. This pattern occurs after a prior uptrend in the price of a security or it can also be spotted at the end of an extended down move.
A continuation pattern is formed after an uptrend. The Cup and Handle pattern formed after an uptrend shows consolidation. And when the price breaks out, the uptrend continues. Meanwhile, after a prolonged downtrend, a reversal pattern occurs which reverses the prior trend. Hence, traders can use the cup and handle pattern to go long on a stock.
The cup and handle chart pattern was developed by William O. Neil.
How to identify the cup and handle pattern?
As the name suggests, the pattern closely represents a cup and a handle.
The cup is a major part of this pattern. It is usually in the shape of a ‘U’ with a rounded bottom but at times, a V-shaped cup is visible too. In the case of an up move, the cup retraces from the prior high to nearly 1/3rd of the previous up move. At the bottom of the cup, accumulation can be seen before it makes another up move before forming the handle.
The cup handle pattern is formed after the cup. The handle is usually a final consolidation or pullback ahead of the breakout which can retrace up to 1/3rd of the cup’s high. The creation of the handle completes the formation of the cup and handle pattern. A smaller retracement generally indicates a more bullish and significant breakout.
How to trade cup and handle pattern?
- Once the handle is formed, the price stages a breakout by taking out the high or resistance level of the handle. This move should be supported by high volumes in order to confirm the breakout.
- Traders can set a target which is equivalent to the vertical size of the cup. The stop loss is usually set below the low of the handle.
- Although, traders should set their target and stop loss according to their financial goals and risk appetite.
It is important to note that the cup and handle chart pattern formation can be seen on various timeframes like 5 minutes, hourly, daily etc.
It is important for traders to know patterns like the cup and handle in order to spot trade opportunities. However, it is also critical to consider other factors that might affect the price of a security. Making use of additional indicators can help in getting more confirmation before a trade.
Related Posts
Don't miss another Article
Subscribe to our blog for free and get regular updates right into your inbox.
Categories


Subscribe for our
newsletter
newsletter