Explore our New and Improved Dashboard for Smarter Stock Market Investments
Introduction:
In today’s fast-paced financial markets, staying informed and making quick decisions can be the key to success. Our new Dashboard is designed specifically for stock market investors to streamline their decision-making process and provide a comprehensive view of the market. Here’s look at the exciting features all aimed at giving you an immersive trading experience. As you scroll you can see in detail some exciting features that we have lined up...
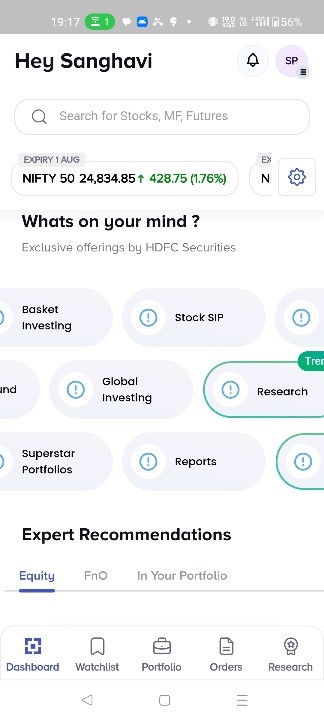
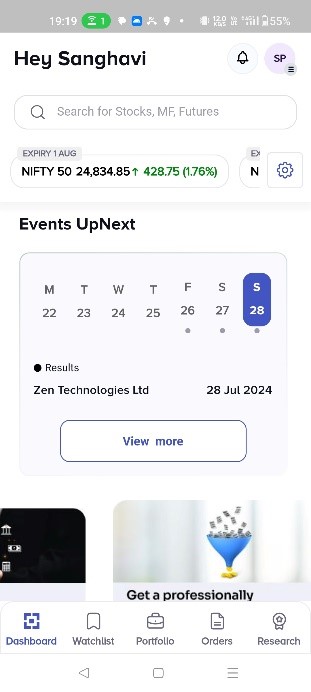
1. Markets Today
Start your trading day with quick glance at the market. Our dashboard now prominently displays the Sensex, Nifty and spot prices of other major indices. By clicking on the indices, you can directly access the option chain of that particular index.
You may also choose to replace the index with some other index that you like by clicking the settings icon available on the right hand side. User can add up to 5 NS/BSE indices of their choice, ensuring you have personalized access to the data that matters most to you. Additionally, expiry date information is also shown.
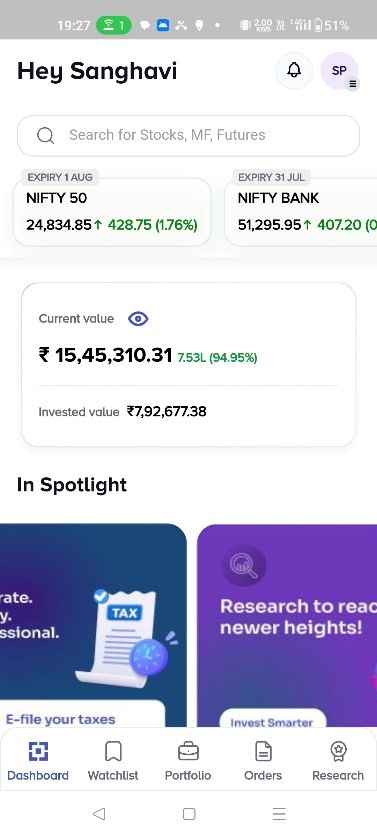
2. Portfolio Performance
Keep track of your investments effortlessly. Right below the indices, you will find a card showing you the performance of your portfolio.
This card will have following data points:
- Portfolio Valuation: The current value of your investments.
- Unrealized PnL: The profit or loss on your investments that not been yet realized.
- Unrealized PnL %: The profit or loss on your investments in terms of percentage.
- Investment Value: The initial amount you invested.
Our intuitive interface makes it easy to stay top of your portfolio and make adjustments as needed. On clicking this card will take you to Portfolio section where you can see further details of your portfolio.
3. What’s on Your Mind
Discover exclusive products and trending investment opportunities with “What’s on Your Mind section. This section highlights products exclusively by HDFC Securities and informs you about trending investment opportunities, providing you an entry point to explore all products offered by us.
This section also serves as an entry points for all critical/major section like IPO/Bond, Stock SIP, Mutual Fund, Reports, NFO, Reports, Superstar Portfolios etc helping you navigate quickly to the areas that matter most to you.
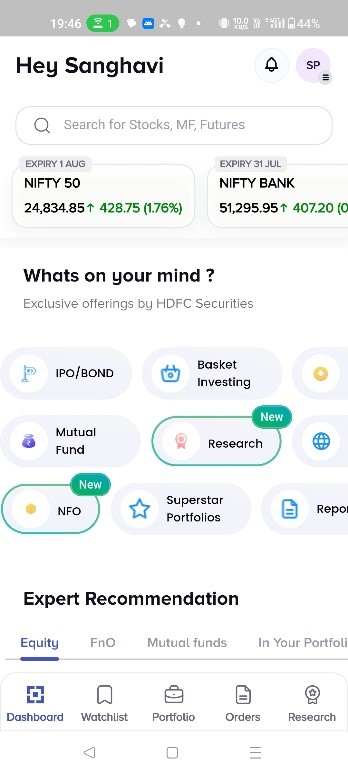
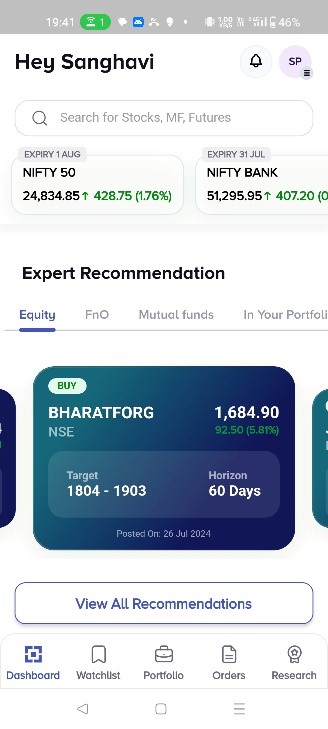
4. Expert/Research Recommendations
Research helps investors to find out the potential of a security before they invest in it. Get access to expert insights with our research recommendations, now organized into four convenient tabs: Equity, Derivatives, Mutual Funds and In Your Portfolio
“In Your Portfolio” is a unique tab which highlight stocks that are already part of your portfolio and recommended by our research analyst. Stay informed on the best actions to take with your current investment based on expert advice.
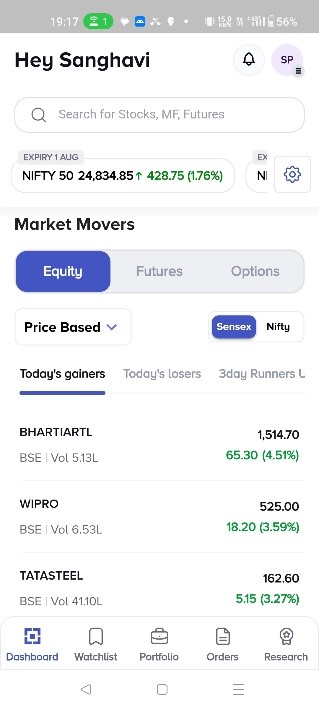
5. Market Movers
Equity:
Here you can see the following data
- Top Gainers – Nifty/Sensex stocks with the highest % gains compared to their last closing price
- Top Losers – Nifty/Sensex stocks with most % losses compared to their last closing price
- Active by Volume – Nifty/Sensex Stocks with the highest level of trading activity by volume today
- Active by Value – Nifty/Sensex Assets with the highest level of trading activity by value today
- 5% Gap Up – Identify stocks that have opened 5 % higher than their previous closing price.
- 5% Gap Down - Identify stocks that have opened 5 % lower than their previous closing price.
- 3 Days Runner Up – See which stocks have consistently risen over past three days.
- 3 Days Runner Down – Monitor stocks that have been declining over past three days
Each list can be expanded by clicking on “View All”.
Additionally, with a simple swipe, you can quickly buy or sell stocks, allowing you to take immediate action based on market movements.
Derivatives:
Here you can see following data
- Top Gainers – Nifty Indices with the highest % gains compared to their last closing price
- Top Losers – Nifty Indices with most % losses compared to their last closing price
- Active by Volume – Nifty Indices/Stocks with the highest level of trading activity by volume today
- Active by Value – Nifty Indices/Stocks with the highest level of trading activity by value today
- Long buildups – Where new long positions are being created, so price and OI are both increasing
- Short buildups – Where new short positions are created, so price is decreasing but OI is increasing.
- Short covering – Where price is increasing but OI is decreasing as sellers are squaring off their trades by buying
- Long unwinding – Where buyers are selling their long positions so the price is falling and so is OI.
Each list can be expanded by clicking on “View All”.
Additionally, with a simple swipe, you can quickly buy or sell any Futures or Options contract, allowing you to take immediate action based on market movements.
6. Bulk/Block Deals & FII/DII Data.
Track large-scale transaction with our Bulk and Block Deals feature on our new Dashboard. This section highlights significant trade in the market, allowing you to identify potential investment opportunities.
Also you can monitor the buying and selling activities of institutional investors with our FII and DII Data section.
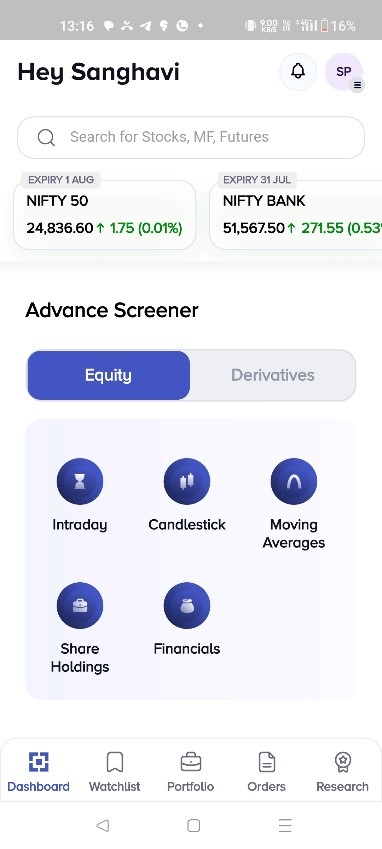
7. Equity and Derivatives Advance Screeners
Find the best investment opportunities with our Advanced Equity and Derivatives screeners.
- a. Equity Screeners – Intraday, Candlestick, Moving Averages, Share Holdings and Financials.
- b. Derivatives Screeners – Futures, Options, Options Screeners, Futures Heatmap and Futures Screeners.
Our screeners are designed to help you discover new trading opportunities that align with your investment strategy.

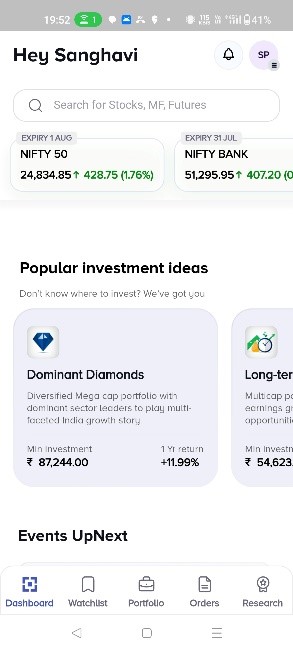
8. Popular Investment Ideas
Explore our section of popular investment ideas, a carefully curated basket of securities backed by thorough research. I This is the easiest method to get started if you're new to the world of financial markets and don't know where to invest.
This is a basket of exchange traded securities (like stocks & ETFs) to reflect a certain objective (ideas, themes, strategies).
9. Event Calendar and Market News
Any Investor or Trader would always want to know about latest stock specific event and Market News. In our latest update you will find this information on Dashboard itself.
This will help you get an early snapshot of Dividends, Stock Splits, Board Meetings, Results etc and other important corporate actions well in advance so that you plan your investing strategies.
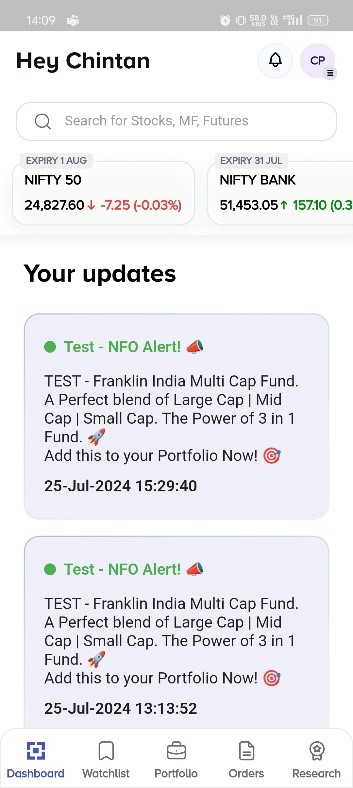
10. Important Updates
Never miss a critical market development with our Important Updates section on our new Dashboard. Receive notifications and insight on major news, regulatory changes, and other significant event that could impact your investments.
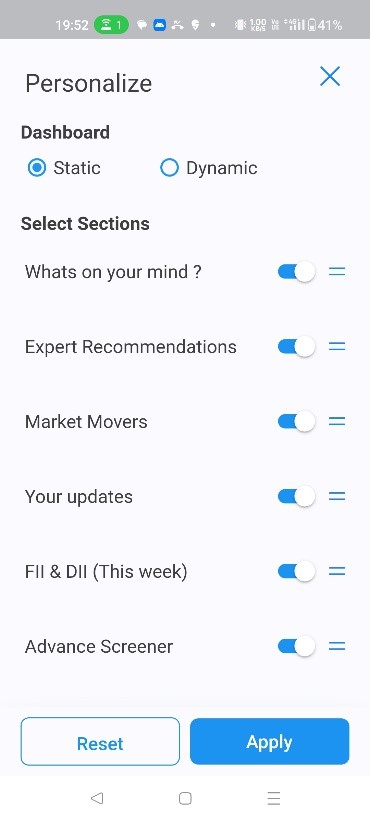
11. Customizable Dashboard
Personalize your trading experience with our customizable dashboard. Rearrange sections to suit your preferences and focus on what matters most to you. You also have option to switch off section you don’t need, creating a streamline and efficient interface that works for you.
Related Posts
Don't miss another Article
Subscribe to our blog for free and get regular updates right into your inbox.
Categories


Subscribe for our
newsletter
newsletter